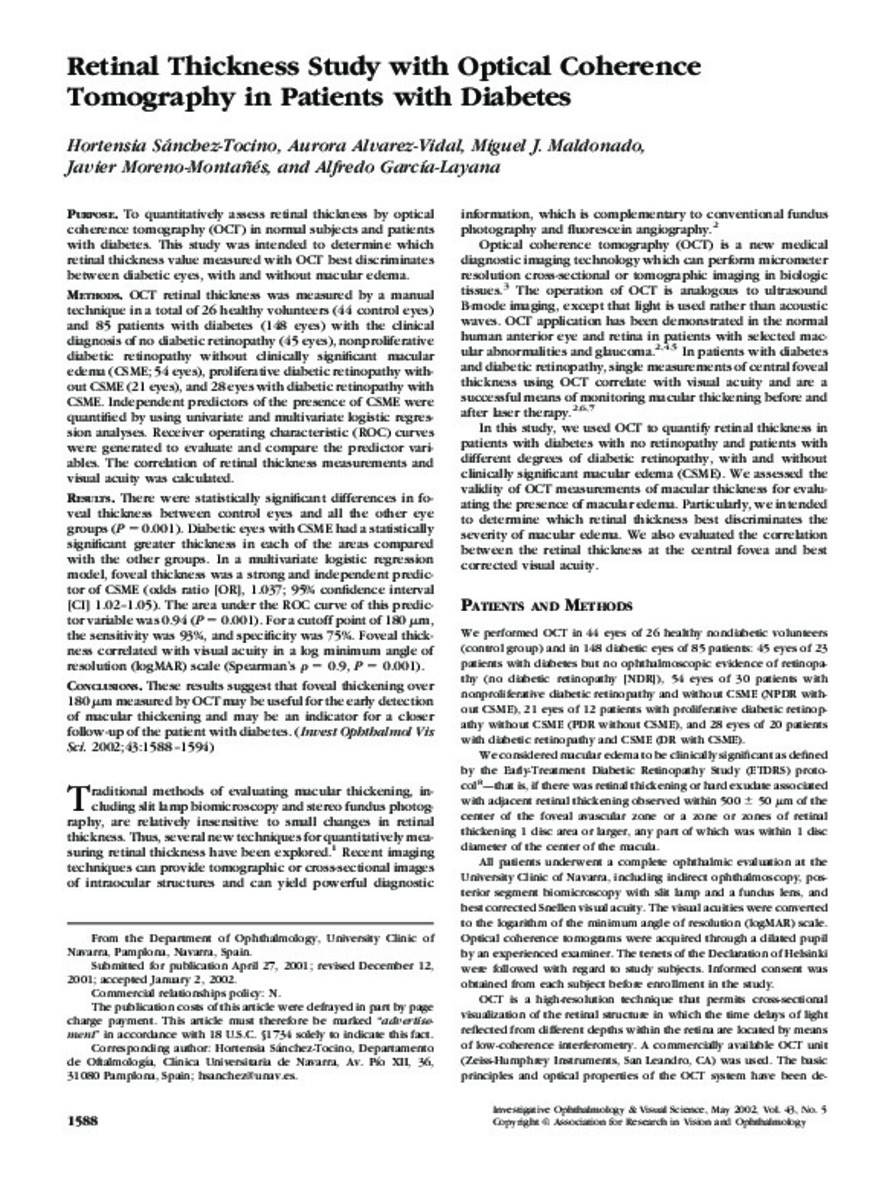
Retinal thickness study with optical coherence tomography in patients with diabetes
Palabras clave : 
Diabetic Retinopathy/classification/diagnosis
Diagnostic Techniques, Ophthalmological
Interferometry
Fecha de publicación : 
2002
Editorial : 
Association for Research in Vision and Ophthalmology
ISSN : 
0146-0404
Cita: 
Sanchez-Tocino H, Alvarez-Vidal A, Maldonado MJ, Moreno-Montanes J, Garcia-Layana A. Retinal thickness study with optical coherence tomography in patients with diabetes. Invest Ophthalmol Vis Sci 2002 May;43(5):1588-1594.
Resumen
To quantitatively assess retinal thickness by optical coherence tomography (OCT) in normal subjects and patients with diabetes. This study was intended to determine which retinal thickness value measured with OCT best discriminates between diabetic eyes, with and without macular edema. METHODS: OCT retinal thickness was measured by a manual technique in a total of 26 healthy volunteers (44 control eyes) and 85 patients with diabetes (148 eyes) with the clinical diagnosis of no diabetic retinopathy (45 eyes), nonproliferative diabetic retinopathy without clinically significant macular edema (CSME; 54 eyes), proliferative diabetic retinopathy without CSME (21 eyes), and 28 eyes with diabetic retinopathy with CSME. Independent predictors of the presence of CSME were quantified by using univariate and multivariate logistic regression analyses. Receiver operating characteristic (ROC) curves were generated to evaluate and compare the predictor variables. The correlation of retinal thickness measurements and visual acuity was calculated. RESULTS: There were statistically significant differences in foveal thickness between control eyes and all the other eye groups (P = 0.001). Diabetic eyes with CSME had a statistically significant greater thickness in each of the areas compared with the other groups. In a multivariate logistic regression model, foveal thickness was a strong and independent predictor of CSME (odds ratio [OR], 1.037; 95% confidence interval [CI] 1.02-1.05). The area under the ROC curve of this predictor variable was 0.94 (P = 0.001). For a cutoff point of 180 microm, the sensitivity was 93%, and specificity was 75%. Foveal thickness correlated with visual acuity in a log minimum angle of resolution (logMAR) scale (Spearman's rho = 0.9, P = 0.001). CONCLUSIONS: These results suggest that foveal thickening over 180 microm measured by OCT may be useful for the early detection of macular thickening and may be an indicator for a closer follow-up of the patient with diabetes.

Ficheros en este ítem:
Vista previa
Fichero
Invest Ophthalmol Vis Sci 2002. 1588.full.pdf
Descripción
Tamaño
558.91 kB
Formato
Adobe PDF


Estadísticas e impacto
0 citas en
0 citas en

Los ítems de Dadun están protegidos por copyright, con todos los derechos reservados, a menos que se indique lo contrario.