Full metadata record
| DC Field | Value | Language |
|---|---|---|
| dc.creator | Bountziouka, V. (Vassiliki) | - |
| dc.creator | Bathrellou, E. (Eirini) | - |
| dc.creator | Zazpe, I. (Itziar) | - |
| dc.creator | Ezquer, L. (Leyre) | - |
| dc.creator | Martinez-Gonzalez, M.A. (Miguel Ángel) | - |
| dc.creator | Panagiotakos, D.B. (Demosthenes B.) | - |
| dc.date.accessioned | 2013-09-30T14:51:17Z | - |
| dc.date.available | 2013-09-30T14:51:17Z | - |
| dc.date.issued | 2012 | - |
| dc.identifier.citation | Bountziouka V, Bathrellou E, Zazpe I, Ezquer L, Martinez-Gonzalez MA, Panagiotakos D.B. Repeatability of Food Frequency Assessment Tools in relation to the number of items and response categories included. Food Nutr Bull. 2012 Dec;33(4):288-95 | es_ES |
| dc.identifier.issn | 0379-5721 | - |
| dc.identifier.uri | https://hdl.handle.net/10171/31942 | - |
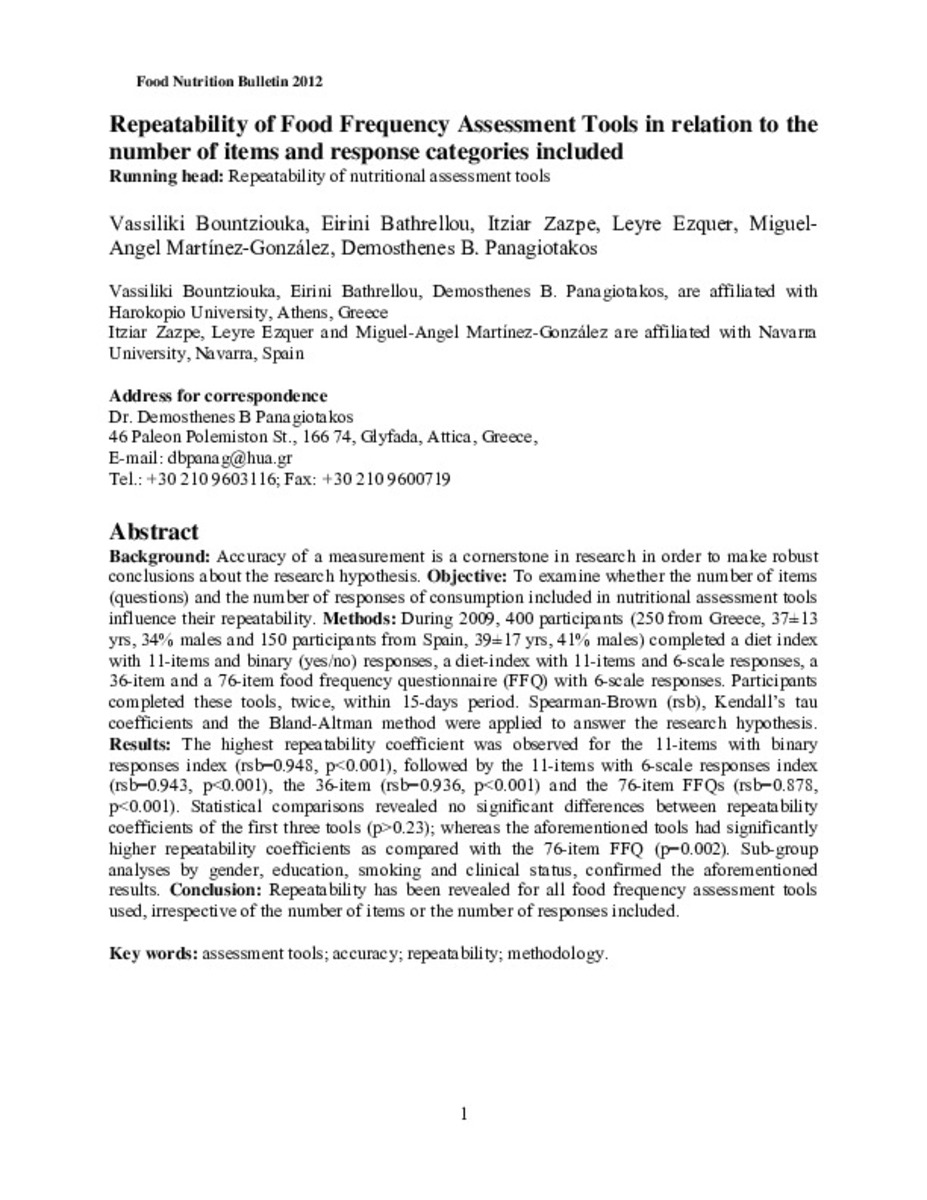
| dc.description.abstract | Background: Accuracy of a measurement is a cornerstone in research in order to make robust conclusions about the research hypothesis. Objective: To examine whether the number of items (questions) and the number of responses of consumption included in nutritional assessment tools influence their repeatability. Methods: During 2009, 400 participants (250 from Greece, 37±13 yrs, 34% males and 150 participants from Spain, 39±17 yrs, 41% males) completed a diet index with 11-items and binary (yes/no) responses, a diet-index with 11-items and 6-scale responses, a 36-item and a 76-item food frequency questionnaire (FFQ) with 6-scale responses. Participants completed these tools, twice, within 15-days period. Spearman-Brown (rsb), Kendall’s tau coefficients and the Bland-Altman method were applied to answer the research hypothesis. Results: The highest repeatability coefficient was observed for the 11-items with binary responses index (rsb=0.948, p<0.001), followed by the 11-items with 6-scale responses index (rsb=0.943, p<0.001), the 36-item (rsb=0.936, p<0.001) and the 76-item FFQs (rsb=0.878, p<0.001). Statistical comparisons revealed no significant differences between repeatability coefficients of the first three tools (p>0.23); whereas the aforementioned tools had significantly higher repeatability coefficients as compared with the 76-item FFQ (p=0.002). Sub-group analyses by gender, education, smoking and clinical status, confirmed the aforementioned results. Conclusion: Repeatability has been revealed for all food frequency assessment tools used, irrespective of the number of items or the number of responses included. | es_ES |
| dc.language.iso | eng | es_ES |
| dc.publisher | International Nutrition Foundation | es_ES |
| dc.rights | info:eu-repo/semantics/openAccess | es_ES |
| dc.subject | Assessment tools | es_ES |
| dc.subject | Accuracy | es_ES |
| dc.subject | Repeatability | es_ES |
| dc.subject | Methodology | es_ES |
| dc.title | Repeatability of food frequency assessment tools in relation to the number of items and response categories included | es_ES |
| dc.type | info:eu-repo/semantics/article | es_ES |
| dc.relation.publisherversion | http://nsinf.publisher.ingentaconnect.com/content/nsinf/fnb/2012/00000033/00000004/art00009 | es_ES |
| dc.type.driver | info:eu-repo/semantics/article | es_ES |
Files in This Item:
Statistics and impact
Items in Dadun are protected by copyright, with all rights reserved, unless otherwise indicated.


